React Performance: Memoization, Code Splitting
On this page
Learning Objective
Diagnose React performance problems by measuring before changing code, choose the right fix among memoization, transitions, code splitting, virtualization and prefetching, set a bundle budget in CI, and avoid performance work that weakens security or correctness.
Concept Explanation
Performance work starts with a question: what is slow, for whom, and by how much. The Core Web Vitals give the vocabulary. Largest Contentful Paint, which should be under 2.5 seconds at the 75th percentile of real users, measures how quickly the main content appears. Interaction to Next Paint, under 200 milliseconds, measures how quickly the page responds to clicks and typing. Cumulative Layout Shift, under 0.1, measures visual stability. Measure with the React DevTools Profiler, which shows which components rendered and why, and the browser's Performance panel, which shows long tasks on the main thread, and confirm with field data from real users rather than only your fast laptop.
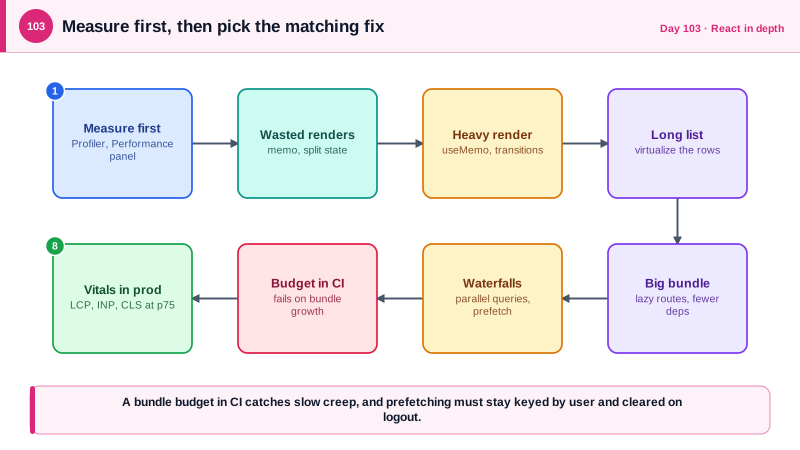
Most React slowness has one of four causes. Too many components re-render because a parent changed, which memoization with React.memo and stable props can prevent, though only where profiling shows a real cost. A single render is expensive, such as filtering a large array on every keystroke, which useMemo can cache or a transition can defer. A list is too long, so the browser lays out thousands of DOM nodes, which virtualization solves by rendering only the visible rows. Or the bundle is too large, so the first load is slow, which code splitting with lazy loading fixes. The React Compiler can add memoization automatically, which reduces the need for hand-written useMemo and useCallback, but it does not remove the need to measure.
React's concurrent features address responsiveness directly. useTransition marks a state update as non-urgent, so typing in a search box stays responsive while a heavy list re-renders in the background, and useDeferredValue defers a value so dependent work happens after urgent updates. Suspense with lazy lets you split the bundle by route and show a fallback while a chunk downloads. And network waterfalls are performance problems too: fetching data only after a component mounts, then fetching more inside a child, serializes requests. Start independent queries in parallel, and prefetch the next screen's data when the user hovers a link, using the query library's prefetching.
Performance interacts with security and correctness in a few places. Prefetching and caching must respect identity, so prefetched data is keyed by user and cleared on logout as on Day 54. Lazy loading third-party scripts is good for speed, but each must still be covered by the Content Security Policy and preferably by Subresource Integrity. Memoization can hide bugs when a memoized value depends on something not in its dependencies. And a performance budget belongs in the pipeline: a bundle size limit that fails the build catches the slow creep of dependencies, which is also how a supply chain surprise shows up, since a compromised or bloated package often changes the size.
| Symptom | Likely cause | Fix |
|---|---|---|
| Typing feels laggy | A heavy render on every keystroke | useDeferredValue or useTransition, useMemo |
| Many components flash in the profiler | Parent re-renders cascade | React.memo with stable props, split state |
| Scrolling a long list is slow | Thousands of DOM nodes | Virtualize with TanStack Virtual |
| Slow first load | Large JavaScript bundle | Route-level lazy loading, remove dependencies |
| Screens load in steps | Request waterfalls | Parallel queries, prefetch on hover |
| Page jumps as it loads | Images and content without reserved space | Set dimensions, skeletons that match layout |
Worked Example: Lazy Routes, a Deferred Search, a Virtual List, Prefetch and a Budget
The snippets apply each fix where a profile would justify it, and end with the CI check that guards the bundle.
// 1. Route-level code splitting: the settings screen is downloaded only when visited.
const SettingsPage = lazy(() => import('./features/settings/SettingsPage'));

<Route path="/settings" element={
  <Suspense fallback={<PageSkeleton />}>
    <SettingsPage />
  </Suspense>
} />

// 2. Keep typing responsive: the input updates now, the expensive list follows.
function TaskSearch({ tasks }: { tasks: Task[] }) {
  const [text, setText] = useState('');
  const deferred = useDeferredValue(text);
  const results = useMemo(() => tasks.filter((t) => t.title.toLowerCase().includes(deferred.toLowerCase())), [tasks, deferred]);
  return (
    <>
      <input value={text} onChange={(e) => setText(e.target.value)} aria-label="Search tasks" />
      <TaskList tasks={results} dimmed={text !== deferred} />
    </>
  );
}// 3. Virtualize a long list: only the visible rows exist in the DOM.
import { useVirtualizer } from '@tanstack/react-virtual';
function VirtualList({ items }: { items: Task[] }) {
const parent = useRef<HTMLDivElement>(null);
const v = useVirtualizer({ count: items.length, getScrollElement: () => parent.current, estimateSize: () => 56, overscan: 8 });
return (
<div ref={parent} style={{ height: 600, overflow: 'auto' }}>
<div style={{ height: v.getTotalSize(), position: 'relative' }}>
{v.getVirtualItems().map((row) => (
<div key={items[row.index].id} style={{ position: 'absolute', top: 0, transform: `translateY(${row.start}px)`, height: row.size, width: '100%' }}>
{items[row.index].title}
</div>
))}
</div>
</div>
);
}
// 4. Prefetch the next screen when the user shows intent, keyed by user like every other query.
const qc = useQueryClient();
<Link to={`/projects/${p.id}`} onMouseEnter={() => qc.prefetchQuery({ queryKey: taskKeys.byProject(userId, p.id), queryFn: () => loadTasks(p.id), staleTime: 30_000 })}>
{p.name}
</Link>{
"scripts": { "size": "size-limit" },
"size-limit": [
{ "path": "dist/assets/index-*.js", "limit": "180 kB", "gzip": true },
{ "path": "dist/assets/*.js", "limit": "450 kB", "gzip": true }
]
}Run the size check in CI so a pull request that adds a heavy dependency fails with a number, and record before and after measurements in the pull request the way Day 80 did for the backend. Do not memoize speculatively: a profile that shows the component is cheap is a reason to leave it alone.
Real-World Examples
- The 2020 study Milliseconds Make Millions, commissioned by Google and Deloitte and covering dozens of retail and travel brands, found that improving mobile site speed by a tenth of a second was associated with measurable increases in conversion rates and average order value. It is the standard citation for the business case for treating frontend performance as a product feature.
- Google replaced First Input Delay with Interaction to Next Paint as a Core Web Vital in March 2024, because it measures the responsiveness of every interaction across a visit, not just the first. Long tasks on the main thread, often caused by heavy renders, are the typical reason for a poor INP score, which is why deferring expensive React work matters.
Review Questions & Answers
Memoization has its own cost and only helps when re-rendering is expensive and props are stable, so applying it everywhere adds complexity and comparison work for no gain. Profile first and memoize the components that actually show wasted renders. The React Compiler can automate much of this safely.
The input state updates immediately for typing, while the value used for the heavy filtering is deferred, so React can render the urgent update first and the expensive list afterward, interrupting that work if the user keeps typing. The input therefore never waits for the list.
Instead of creating ten thousand DOM nodes, it renders only the rows currently visible plus a small overscan, and positions them as the user scrolls. Layout and memory costs stay roughly constant regardless of the list length.
Bundles grow gradually as dependencies and features are added, and no single change looks harmful. A budget that fails the build turns the slow creep into a visible decision, and an unexpected jump in size can also reveal an accidental or malicious dependency.