SLIs, SLOs and Error Budgets for App Teams
On this page
Learning Objective
Define service level indicators and objectives for user journeys, compute error budgets, write multi-window burn-rate alerts that page on real user impact, and run an on-call and incident process with runbooks and blameless postmortems, including security events.
Concept Explanation
Day 79 introduced alerting on health checks and Day 78 gave you metrics and traces. The remaining question is what to alert on and how reliable the service should be. Service level terminology answers it. A service level indicator, or SLI, is a measurement of behavior users care about, best expressed as the proportion of good events out of valid events: the fraction of requests that succeeded and returned within 500 milliseconds, the fraction of uploads that completed. A service level objective, or SLO, is the target for that indicator over a window, such as 99.9 percent of valid requests good over 30 days. A service level agreement, or SLA, is a contract with consequences, usually looser than the internal SLO. Choosing indicators from the user's point of view matters: server CPU is a cause, whereas failed checkouts are a symptom, and you should alert on symptoms.
An SLO of 99.9 percent leaves a budget: 0.1 percent of events may be bad, which is about 43 minutes of full outage in a 30 day month. That error budget turns reliability into a decision instead of an argument. While budget remains, the team ships features and takes reasonable risks. When it is spent, the team shifts effort to reliability until it recovers, a rule written down as an error budget policy that product and engineering agree in advance. A target of 100 percent is a mistake, since it is unachievable and forbids any change; pick a target that matches what users need and what dependencies allow, since your service cannot be more reliable than what it depends on.
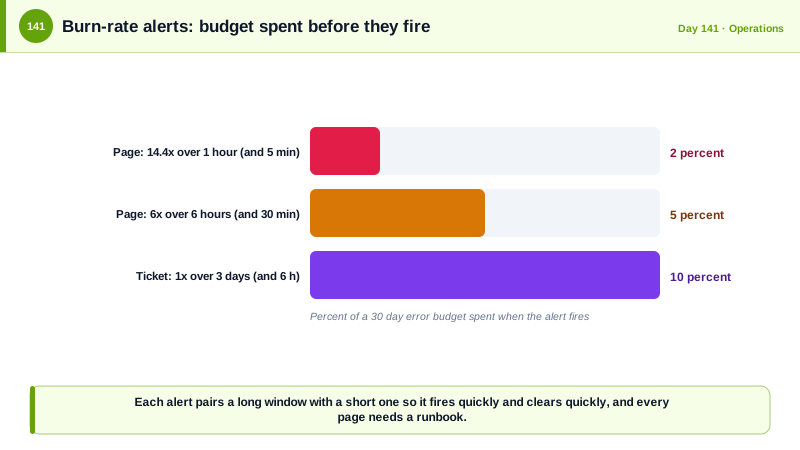
Alerting on the budget rather than on single spikes reduces noise. The burn rate is how fast you are consuming the budget relative to the allowed rate, where a burn rate of one would use exactly the whole budget by the end of the window. The approach in the Google SRE Workbook combines a long and a short window for each alert, so it fires quickly for a serious problem yet resets promptly when the problem stops: a burn rate above 14.4 over one hour, confirmed over five minutes, means about two percent of a monthly budget gone in an hour and pages someone; above 6 over six hours, confirmed over 30 minutes, also pages; and a burn rate of 1 over three days, confirmed over six hours, opens a ticket. Every page should need a human and describe user impact, since alert fatigue makes people ignore the pager.
On-call is the human system around that. Rotations should be sustainable and shared, with a primary and a secondary, handoffs, and compensation. Each alert links to a runbook: what it means, how to check impact, first mitigation steps, and who to escalate to, with rollback and feature flag switches listed first, as mitigation comes before root cause. Define severity levels, and for larger incidents assign an incident commander who coordinates while others investigate, with a communication lead who updates stakeholders. Afterward, hold a blameless postmortem, which asks what allowed the failure and how the system and process can improve, as Etsy engineers described in 2012, and track the follow-up actions to completion. Security incidents fit the same structure, with additional rules: the on-call engineer must be able to reach the security team, evidence must be preserved before it is cleaned up, and runbooks must not contain secrets. Grant on-call elevated access just in time through a controlled process, with logging, instead of standing administrator rights.
| Term | Meaning | Example |
|---|---|---|
| SLI | A measure of good events over valid events | Requests with status below 500 and under 500 ms, divided by all valid requests |
| SLO | Target for an SLI over a window | 99.9 percent over 30 days |
| Error budget | Allowed bad events, 100 percent minus the SLO | 43 minutes of downtime per 30 days at 99.9 percent |
| Burn rate | Speed of consuming the budget, relative to allowed | 14.4 over 1 hour pages, 1 over 3 days makes a ticket |
| Runbook | Steps for a specific alert | Check dashboard, roll back, disable flag, escalate |
| Postmortem | Blameless review with tracked actions | Timeline, contributing factors, improvements |
Worked Example: SLI Metrics in Code, a Burn-Rate Query and a Runbook
The application emits good and valid counters, the queries compute burn, and the runbook template documents the response.
// SLI measurement: count valid and good events per route group with System.Diagnostics.Metrics (exported by OpenTelemetry).
public static class Sli
{
    private static readonly Meter Meter = new("TaskBoard.Sli");
    public static readonly Counter<long> Valid = Meter.CreateCounter<long>("sli.requests.valid");
    public static readonly Counter<long> Good  = Meter.CreateCounter<long>("sli.requests.good");
}

app.Use(async (ctx, next) =>
{
    var sw = Stopwatch.StartNew();
    await next();
    var journey = ctx.GetEndpoint()?.Metadata.GetMetadata<JourneyAttribute>()?.Name;     // for example "create-task", "list-tasks"
    if (journey is null) return;

    var status = ctx.Response.StatusCode;
    var clientError = status is >= 400 and < 500 and not 429;                               // the caller's mistake is not an unreliable service
    if (clientError) return;                                                                 // not a valid event for the SLI
    var tag = new KeyValuePair<string, object?>("journey", journey);
    Sli.Valid.Add(1, tag);
    if (status < 500 && sw.ElapsedMilliseconds < 500) Sli.Good.Add(1, tag);
});// Burn rate over a window for the create-task journey, against a 99.9 percent SLO (budget = 0.001).
let slo_budget = 0.001;
let window = 1h;
customMetrics
| where name in ("sli.requests.valid", "sli.requests.good") and timestamp > ago(window)
| extend journey = tostring(customDimensions.journey)
| where journey == "create-task"
| summarize valid = sumif(valueSum, name == "sli.requests.valid"), good = sumif(valueSum, name == "sli.requests.good")
| extend bad_ratio = 1.0 - (todouble(good) / todouble(valid))
| extend burn_rate = bad_ratio / slo_budget // 1.0 spends the budget exactly at the end of the window; page above 14.4 here# Alert policy: two windows per rule so alerts fire fast and clear quickly. Thresholds follow the SRE Workbook for a 30 day SLO.
alerts:
- name: create-task-fast-burn # pages
when: burn_rate(1h) > 14.4 AND burn_rate(5m) > 14.4
action: page-primary
- name: create-task-slow-burn # pages
when: burn_rate(6h) > 6 AND burn_rate(30m) > 6
action: page-primary
- name: create-task-budget-leak # ticket only
when: burn_rate(3d) > 1 AND burn_rate(6h) > 1
action: create-ticket
error_budget_policy:
budget_remaining_below_25_percent: freeze risky launches, prioritize reliability work
budget_exhausted: only fixes and reliability changes until the window recovers# Runbook: create-task-fast-burn
**Meaning:** More than about 1.4 percent of task creations are failing or slow. Users cannot add tasks.
**Check first (2 minutes):** dashboard "Create task", recent deployment, dependency panel (SQL, Service Bus), status page of Azure.
**Mitigate before diagnosing:**
1. Was there a deployment in the last hour? Roll back (pipeline "rollback", one click) and watch the burn rate.
2. Is a feature flag involved? Disable it (Day 89).
3. Is SQL saturated? Scale up the database tier, then investigate the query.
**Escalate:** secondary on-call after 15 minutes without improvement. Security team if you see unusual authentication or data access.
**Do not:** paste tokens or connection strings into the incident channel. Access to production data is through the approved break-glass process.
**After:** open a postmortem for any page longer than 30 minutes or any budget loss above 10 percent.Review the alerts every quarter and delete the ones nobody acts on. A page that nobody needs to respond to is training people to ignore the pager.
Real-World Examples
- Google's Site Reliability Engineering book, published in 2016, popularized service level objectives and error budgets, and the follow-up Workbook in 2018 described the multi-window burn-rate alerting used in this lesson. Their central argument is that reliability should be a negotiated, measured target, not an aspiration of perfection, and that the budget aligns product and operations incentives.
- John Allspaw of Etsy published Blameless PostMortems and a Just Culture in 2012, arguing that asking who made the mistake discourages people from reporting problems, while asking how the system allowed the mistake reveals what to fix. The approach has become standard in incident reviews across the industry.
Review Questions & Answers
It is unachievable, since dependencies and change always introduce some failure, and it leaves no error budget so any change would violate it. A target matched to user needs gives room to ship while still protecting reliability.
Burn rate relates the current error rate to the rate that would exhaust the budget, so the alert reflects the risk to the objective. Using a long and a short window makes it fire for sustained problems and stop soon after they end, which reduces noise.
Users are affected while you investigate, and actions such as rolling back a release or disabling a flag restore service quickly. Finding the root cause can wait until the impact has stopped.
It examines how the system, process, and tools allowed the failure instead of who made the error. People then report problems and near misses openly, which produces improvements that prevent recurrence.