Frontend Observability: Web Vitals and Error Tracking
On this page
Learning Objective
Collect real-user performance and error data from a React app, connect browser traces to the .NET backend with W3C trace context, protect users' privacy and secrets in telemetry, and use CSP reporting to find client-side attacks.
Concept Explanation
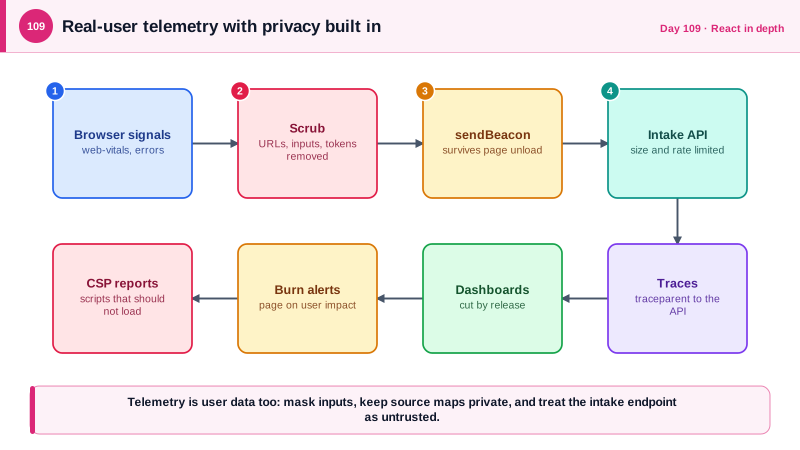
Backend telemetry from Days 77 and 78 tells you what your servers saw, but many failures never reach the server: a script error in an old browser, a blocked third-party script, a slow render on a low-end phone. Frontend observability closes that gap with three signals. Real user monitoring collects Core Web Vitals such as Largest Contentful Paint and Interaction to Next Paint from actual visits, using the small web-vitals library, and reports them with navigator.sendBeacon so measurement survives page unloads. Error tracking captures unhandled exceptions and rejected promises, groups them by cause, and records the release version and breadcrumbs of what led to the failure. Distributed tracing extends the backend trace into the browser, so a slow click can be followed through the API call to the database query.
The mechanism that links the two worlds is the W3C Trace Context standard. The browser starts a trace and sends a traceparent header on API calls, the ASP.NET Core OpenTelemetry instrumentation continues it, and the trace id in an error report matches the one in the server logs. Two practical points apply. Because the API is same-origin behind the BFF, the header passes without special CORS settings; if you ever call a cross-origin API, that origin must allow the header explicitly. And the trace or correlation id shown to a user in an error message, as on Day 55, gives support a direct route from a screenshot to the server-side trace.
Telemetry is also data collection, and it needs the same care as any other storage of user data. Error reports and session recordings can capture personal information in URLs, form fields, and request bodies, so scrub sensitive parameters, mask all inputs by default in any session replay tool, and never send tokens, passwords, or full response bodies. Apply consent rules where the law requires them and sample high-volume events. Source maps deserve a decision: uploading them to the error tracking service lets it show readable stack traces, while publishing them on the public site reveals your source code and comments, so upload them privately and do not serve them to the public. Treat the reporting endpoint as untrusted input on your side, since anyone can post to it, and rate limit and validate it.
The browser can also report attacks and policy violations to you. A Content Security Policy with a report-to directive sends a report whenever a script or resource is blocked, and running in report-only mode first lets you see what a stricter policy would break before enforcing it. Unexpected reports, such as a script from an unknown domain, are an early warning for cross-site scripting and for compromised third-party scripts. Set alerts on error rates by release so a bad deployment is caught in minutes, and use the release marker to link a spike to the change that caused it.
| Signal | Collected with | Answers |
|---|---|---|
| Web Vitals (LCP, INP, CLS) | web-vitals library and sendBeacon | Is the real user experience fast and stable? |
| Errors and rejections | Error tracker with release and breadcrumbs | What broke, for whom, in which release? |
| Traces | OpenTelemetry browser SDK, traceparent | Where did this slow click spend its time? |
| CSP violation reports | Content-Security-Policy report-to | Is something loading that should not? |
| Session replay (optional) | A replay tool with inputs masked | What did the user do before the failure? |
| Release health | Error rate per release version | Did this deployment make things worse? |
Worked Example: Reporting Vitals and Errors, Tracing to the API and Scrubbing
The client reports vitals and errors with scrubbing, and the server accepts telemetry defensively and enables CSP reporting.
// telemetry.ts
import { onLCP, onINP, onCLS } from 'web-vitals';

const RELEASE = import.meta.env.VITE_RELEASE;               // set by CI, for example the commit id

function scrubUrl(raw: string) {
  const u = new URL(raw, location.origin);
  for (const key of [...u.searchParams.keys()]) if (/token|code|email|key|session/i.test(key)) u.searchParams.set(key, '[redacted]');
  return u.origin + u.pathname + u.search;                  // fragments dropped: they can carry tokens
}

function send(type: string, payload: unknown) {
  const body = JSON.stringify({ type, release: RELEASE, url: scrubUrl(location.href), payload, t: Date.now() });
  if (!navigator.sendBeacon('/telemetry', new Blob([body], { type: 'application/json' }))) {
    fetch('/telemetry', { method: 'POST', body, keepalive: true, headers: { 'Content-Type': 'application/json' } });
  }
}

for (const report of [onLCP, onINP, onCLS]) report((m) => send('vital', { name: m.name, value: m.value, rating: m.rating }));

window.addEventListener('error', (e) => send('error', { message: e.message, stack: e.error?.stack?.slice(0, 4000) }));
window.addEventListener('unhandledrejection', (e) => send('rejection', { reason: String(e.reason).slice(0, 500) })); // never the whole response or object// Trace context: a fetch wrapper starts a span and propagates traceparent to the same-origin API.
import { trace, context, propagation } from '@opentelemetry/api';
const tracer = trace.getTracer('web');
export async function tracedFetch(input: string, init: RequestInit = {}) {
return tracer.startActiveSpan(`fetch ${init.method ?? 'GET'} ${new URL(input, location.origin).pathname}`, async (span) => {
const headers = new Headers(init.headers);
propagation.inject(context.active(), headers, { set: (h, k, v) => h.set(k, v) }); // adds traceparent
try { return await fetch(input, { ...init, headers }); } finally { span.end(); }
});
}// Server: telemetry intake is untrusted input. Validate, size-limit, rate limit, and never echo it back.
app.MapPost("/telemetry", async (HttpContext ctx, ILogger<Program> log) =>
{
using var reader = new StreamReader(ctx.Request.Body);
var raw = await reader.ReadToEndAsync();
if (raw.Length > 16_000) return Results.StatusCode(StatusCodes.Status413PayloadTooLarge);
log.LogInformation("client telemetry {Kind} received", ctx.Request.Query["k"].ToString()); // sanitize: do not log raw client text at high volume
return Results.NoContent();
}).RequireRateLimiting("telemetry");
// CSP violation reporting, enforced policy plus a stricter report-only trial.
app.Use(async (ctx, next) =>
{
ctx.Response.Headers["Content-Security-Policy"] = "default-src 'self'; script-src 'self'; report-to csp";
ctx.Response.Headers["Content-Security-Policy-Report-Only"] = "default-src 'self'; script-src 'self'; style-src 'self'; report-to csp";
ctx.Response.Headers["Reporting-Endpoints"] = "csp=\"/csp-reports\"";
await next();
});The scrubbing and length limits are deliberate: telemetry should help you debug without becoming a second, poorly protected copy of your users' data.
Real-World Examples
- In 2017, researchers at Princeton reported that several session replay scripts used on popular sites were sending page content, including typed passwords and other form fields, to third-party servers. The finding led to several vendors changing their defaults and to the guidance to mask inputs by default and audit what any replay or analytics script collects.
- The 2018 British Airways breach, attributed to the Magecart group, involved malicious JavaScript injected into the airline's payment page that sent customers' card details to an attacker-controlled server. The UK Information Commissioner announced a fine of 20 million pounds in October 2020, and the case is the standard example of why client-side integrity, CSP with reporting, and monitoring of third-party scripts matter.
Review Questions & Answers
Many failures happen only in the browser, such as script errors on particular devices, slow rendering, or blocked third-party scripts, and the server never sees them. Frontend telemetry captures those experiences from real users and connects them to backend traces.
The browser starts a trace and sends the W3C traceparent header with API calls, and the OpenTelemetry instrumentation in ASP.NET Core continues that trace. The same trace id then appears in browser reports and server logs, so one slow interaction can be followed end to end.
Reports and recordings can capture personal data in URLs, form fields, and payloads. Scrubbing sensitive parameters, masking inputs by default, truncating payloads, honoring consent requirements, and never sending tokens keep telemetry from becoming a data leak.
Report-only mode sends violation reports without blocking anything, so the team can see which legitimate resources a stricter policy would break and fix them before enforcing it. The same reports can also reveal unexpected scripts that may indicate an attack.