.NET Performance: Span, GC, BenchmarkDotNet, AOT
On this page
Learning Objective
Measure .NET performance with BenchmarkDotNet and runtime diagnostics, reduce allocations with Span, pooling and value types where measurement justifies it, configure the garbage collector for containers, and decide when Native AOT is appropriate, without breaking security properties.
Concept Explanation
The first rule of performance is the one Day 80 established: measure, do not guess. Most API slowness comes from the database, the network, or the number of round trips, and no amount of micro-optimization in C# fixes a missing index. When the profile does show time in your code, the usual cause in .NET is allocation. Every object placed on the managed heap must later be collected by the garbage collector, and frequent allocations in hot paths cause frequent collections that pause work and consume CPU. The generational collector is very good at short-lived objects, so most code is fine; the goal is to find the few hot paths, such as per-request parsing or per-item loops, where allocations pile up.
The tools for reducing allocations are well defined. Span of T and ReadOnlySpan of T are views over contiguous memory, including a slice of an array or a string, without copying, and they let a parser walk a string without creating substrings. Stackalloc places small buffers on the stack. ArrayPool rents and returns arrays so large buffers are reused instead of reallocated. Structs and record structs avoid heap allocation for small values, but copying large structs can cost more than a class, so measure. StringBuilder beats repeated concatenation in loops, and LINQ, while convenient, allocates enumerators and closures, so a hot loop may be clearer and faster as a plain for loop. ValueTask avoids allocating a Task when an operation often completes synchronously, though it has usage restrictions. BenchmarkDotNet is the standard tool to compare versions, because it handles warm-up, statistical analysis, and reports allocated bytes per operation.
For live services, use the runtime's diagnostics instead of guessing: dotnet-counters shows GC counts, heap size, and thread pool queue length in real time, dotnet-trace collects traces, and dotnet-dump inspects memory. In containers, configure the GC deliberately. The server GC uses a heap per core and favors throughput, the workstation GC uses less memory, and containers with a memory limit and a small CPU quota can behave differently from your laptop. Set limits and test under them, since a memory limit that is too tight leads to out-of-memory kills, which an orchestrator reports as restarts, while unbounded caches or large request buffers cause the same result.
Native AOT compiles an application ahead of time into a self-contained native executable. It gives very fast startup and lower memory use, which suits serverless functions and containers that scale from zero, at the cost of restrictions: no runtime code generation, limited reflection, trimming of unused code, and the need for source generators, which is why Day 111 introduced them. ASP.NET Core supports it for minimal APIs through the slim builder, while parts such as full MVC controllers and Entity Framework Core have more limited support, so check compatibility before committing. Performance work must not undermine security. Pooled buffers are not cleared by default, so a buffer that held a password or token must be cleared when returned to the pool, otherwise the next renter can read it, the same class of problem behind the Heartbleed bug. Secret comparisons must remain constant time with CryptographicOperations.FixedTimeEquals, even if a faster early exit comparison exists. And unsafe code and manual memory tricks give up the memory safety that is one of .NET's security advantages, so avoid them unless a benchmark proves the need.
| Technique | Helps when | Caution |
|---|---|---|
| Measure with BenchmarkDotNet | Comparing two implementations | Benchmark realistic data and sizes |
| Span and stackalloc | Parsing and slicing without copies | Cannot be stored in fields or used across await |
| ArrayPool | Large temporary buffers | Clear sensitive buffers before returning them |
| Struct types | Small, short-lived values | Large structs are costly to copy |
| For loops instead of LINQ | Hot paths with many items | Only after profiling shows LINQ matters |
| Native AOT | Fast startup, small memory, scale to zero | Reflection and runtime codegen are restricted |
Worked Example: A Benchmark, an Allocation-Free Parser and a Safe Pooled Buffer
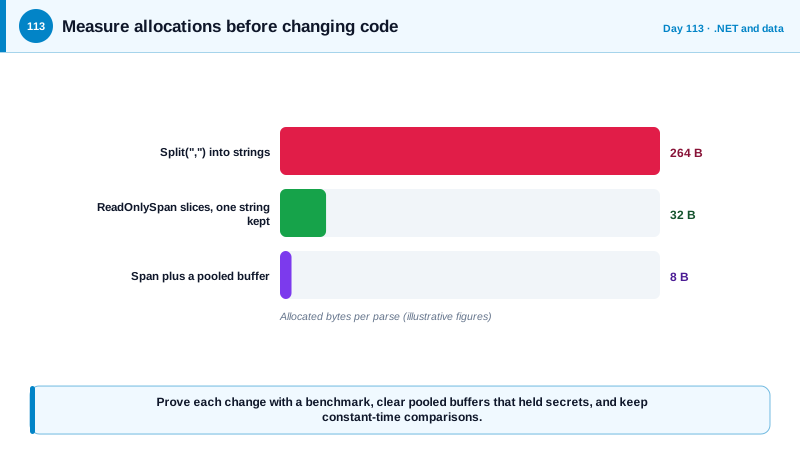
The benchmark compares a string-splitting parser with a span-based one. The last block shows sensitive buffer handling and the AOT-ready host.
// A benchmark project, run in Release with: dotnet run -c Release
[MemoryDiagnoser]
public class ParseBenchmarks
{
    private const string Line = "42,in-progress,2026-09-25,alice";

    [Benchmark(Baseline = true)]
    public (int, string) SplitVersion()
    {
        var parts = Line.Split(',');                       // allocates an array and four strings
        return (int.Parse(parts[0]), parts[1]);
    }

    [Benchmark]
    public (int, string) SpanVersion()
    {
        ReadOnlySpan<char> s = Line;
        var first = s.IndexOf(',');
        var id = int.Parse(s[..first]);                    // parses directly from the slice, no substring
        var rest = s[(first + 1)..];
        var second = rest.IndexOf(',');
        return (id, rest[..second].ToString());            // one allocation, only for the value we keep
    }
}
// The [MemoryDiagnoser] column "Allocated" shows bytes per operation, which is what the change is for.// Pooled buffers are NOT cleared for you. Clear anything sensitive before returning it.
var buffer = ArrayPool<byte>.Shared.Rent(4096);
try
{
var read = await stream.ReadAsync(buffer.AsMemory(0, 4096), ct);
Process(buffer.AsSpan(0, read));
}
finally
{
ArrayPool<byte>.Shared.Return(buffer, clearArray: true); // the next renter cannot read this request's data
}
// Performance must not weaken secret comparison: constant time, even though a plain == is faster.
static bool TokenMatches(ReadOnlySpan<byte> supplied, ReadOnlySpan<byte> expected) =>
CryptographicOperations.FixedTimeEquals(supplied, expected);// A minimal API prepared for Native AOT: slim builder and source-generated JSON.
var builder = WebApplication.CreateSlimBuilder(args);
builder.Services.ConfigureHttpJsonOptions(o => o.SerializerOptions.TypeInfoResolverChain.Insert(0, AppJsonContext.Default));
var app = builder.Build();
app.MapGet("/health", () => Results.Ok(new HealthDto("ok")));
app.Run();
// In the project file: <PublishAot>true</PublishAot>. Publish, then test the published binary, not only the debug build,
// since trimming and AOT problems appear only in the published output.Runtime checks on a live container (no code changes):
dotnet-counters monitor --process-id 1 System.Runtime # gen0/1/2 GC counts, heap size, thread pool queue length
dotnet-trace collect --process-id 1 --duration 00:00:30 # a trace to open in PerfView or Visual Studio
Container limits to set and test under: memory limit, CPU quota, and DOTNET_gcServer / DOTNET_GCHeapHardLimit where neededReport the benchmark table in the pull request with allocated bytes per operation before and after. A change that saves nanoseconds in code that runs once per request is not worth the complexity it adds.
Real-World Examples
- The Heartbleed bug, disclosed in April 2014 in the OpenSSL library, allowed attackers to read up to 64 kilobytes of server memory per request because a length was not checked, exposing keys, passwords, and other data that had lived in reused memory. It is the reason to treat recycled buffers as potentially sensitive and to clear them, even in managed languages that make such bugs less likely.
- Stack Overflow has described running its network of sites on a small number of servers by paying close attention to performance, including allocations and caching in hot paths, and the .NET team has published many allocation improvements release by release. Both illustrate that the payoff comes from measuring real workloads, not from applying tricks everywhere.
Review Questions & Answers
Every heap allocation must later be collected, and frequent collections in hot paths consume CPU and cause pauses. Removing unnecessary allocations in code that runs constantly reduces garbage collection work and improves throughput and latency.
It handles warm-up, repeated runs, statistical analysis, and jitter, and its memory diagnoser reports bytes allocated per operation. That produces reliable comparisons instead of noisy single measurements.
It suits services that need fast startup and low memory, such as serverless functions and containers that scale from zero. The cost is restrictions on reflection and runtime code generation, trimming of unused code, and the need to verify that libraries and features work in the published binary.
Rented buffers are reused without being erased, so a later renter could read leftover bytes from the earlier request. Clearing on return removes sensitive data from memory that other code can access.