Load Testing with k6 and Profiling .NET Endpoints
On this page
Learning Objective
Write a realistic k6 load test with thresholds, find and fix the cause of a slow endpoint using traces, plans and profilers, measure the improvement, add a small performance guard to the pipeline, and treat rate limiting and load testing as complementary parts of resilience and security.
Concept Explanation
Performance work follows the same discipline as debugging: measure, form a hypothesis, change one thing, and measure again. The temptation is to optimize by intuition, and intuition is wrong more often than not. The first step is to define what fast enough means, as service level objectives: for example, the board endpoint answers in under 300 milliseconds at the 95th percentile with a 99.5 percent success rate at the expected peak load. Percentiles matter more than averages because averages hide the slow tail that real users experience, and a few slow requests matter when a page makes many calls.
k6, an open source load testing tool from Grafana Labs, uses JavaScript for test scripts, which suits a frontend developer. A script defines a scenario, such as ramping from zero to fifty virtual users over a couple of minutes and holding, and thresholds, which are pass or fail criteria for metrics such as p95 duration and error rate. The result is a command that exits non-zero when the system misses its objectives, so it can gate a pipeline. To be meaningful, the test must be realistic: use authenticated requests with tokens for test users, spread across many users and projects instead of hammering one record, include think time between actions, and use a database seeded with production-like volumes, since a query that is instant against a hundred rows can be catastrophic against ten million.
Run load tests only against an environment built for it, never production without explicit agreement, and never against third-party services you do not control, which you should stub. There is a security interaction to plan for: your rate limiter and other protections should engage under load. A test that expects every request to succeed will fail, correctly, once limits kick in, so run the throughput test from identities and addresses allowlisted for it, and add a separate test that verifies the protections themselves, checking that abusive rates receive 429 responses while normal users are unaffected. Load tests are also a safe way to find denial-of-service weaknesses in your own system, such as an endpoint whose cost grows with a user-controlled parameter.
When a threshold fails, investigate top down. The OpenTelemetry trace of a slow request from Day 78 shows which span dominates. If it is a database span, look at the SQL and its execution plan from Day 39, and at the query counts for N+1 patterns from Day 35. If it is application time, profile with dotnet-trace or dotnet-counters, which attach to a running process without changes, to see hot methods, garbage collection, and thread pool starvation. Fix the largest contributor, re-run the same test, and record the before and after in the pull request. On the client, measure with the Core Web Vitals, the largest contentful paint, interaction to next paint, and cumulative layout shift, using the web-vitals library and Lighthouse, and examine the bundle for oversized dependencies to split or remove.
| Step | Tool | Output |
|---|---|---|
| Define objectives | SLOs with percentiles | p95 under 300 ms, error rate under 0.5 percent |
| Generate load | k6 scenarios and thresholds | Pass or fail exit code, metrics summary |
| Locate the bottleneck | OpenTelemetry trace waterfall | Dominant span and its query |
| Inspect the cause | Execution plan, query counts, dotnet-trace | Missing index, N+1, hot method |
| Fix and re-measure | Same test, same data | Documented before and after numbers |
| Guard against regression | Small smoke load in CI | Fails on a large slowdown |
Worked Example: A Load Test, an Investigation and the Fix
The k6 script exercises the board endpoint under a ramp with thresholds. The narrative that follows uses illustrative numbers to show how the investigation reads. The fix removes an N+1 and adds a covering index.
// load/board.js  (k6 run load/board.js)
import http from 'k6/http';
import { check, sleep } from 'k6';
import { SharedArray } from 'k6/data';

const users = new SharedArray('users', () => JSON.parse(open('./test-users.json')));   // generated tokens for TEST users only

export const options = {
  scenarios: {
    board_reads: {
      executor: 'ramping-vus',
      stages: [{ duration: '1m', target: 50 }, { duration: '3m', target: 50 }, { duration: '30s', target: 0 }],
    },
  },
  thresholds: {
    http_req_duration: ['p(95)<300'],                 // the objective
    http_req_failed: ['rate<0.005'],
    'http_req_duration{name:board}': ['p(95)<300', 'p(99)<800'],
  },
};

export default function () {
  const u = users[(__VU - 1) % users.length];         // spread load across many users and projects
  const res = http.get(`${__ENV.BASE_URL}/api/projects/${u.projectId}/tasks?pageSize=25`, {
    headers: { Authorization: `Bearer ${u.token}` },
    tags: { name: 'board' },
  });
  check(res, {
    'status is 200': (r) => r.status === 200,
    'has items': (r) => r.json('items') !== undefined,
    'no stack traces': (r) => !/\bat [A-Za-z_.]+\(/.test(r.body),
  });
  sleep(1 + Math.random() * 2);                       // think time: real users pause between actions
}Illustrative investigation (numbers are examples, not measurements from a real system)
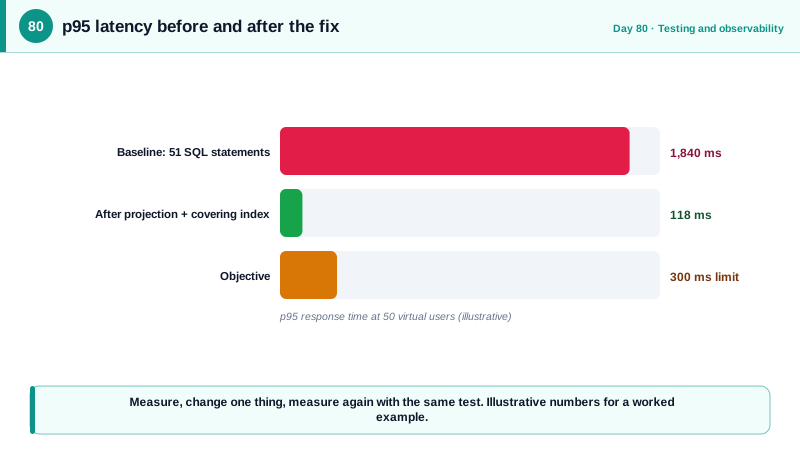
Run 1 (baseline): p95 = 1,840 ms, 50 virtual users, threshold FAILED
Trace of a slow request:
GET /api/projects/{projectId}/tasks 1,790 ms
SQL: SELECT ... FROM Tasks WHERE ProjectId = @p 22 ms
SQL: SELECT ... FROM Users WHERE Id = @p 3 ms x 25 repeated calls <-- N+1: one query per row for the assignee
SQL: SELECT COUNT(*) FROM Comments WHERE TaskId=@p 41 ms x 25 repeated calls <-- second N+1
Hypothesis: 51 round trips per request. Fix the query shape, then check the plan for the count.// BEFORE: loads tasks, then touches navigation properties per row.
var tasks = await db.Tasks.Where(t => t.ProjectId == projectId).Take(25).ToListAsync(ct);
foreach (var t in tasks) { dto.Add(new TaskRow(t.Id, t.Title, t.Assignee.DisplayName, t.Comments.Count)); }
// AFTER: one projected query. EF generates a join and a correlated count; the caller's membership filter stays in the query.
var rows = await db.Tasks.AsNoTracking()
.Where(t => t.ProjectId == projectId && t.Project.Members.Any(m => m.UserId == me))
.OrderByDescending(t => t.CreatedAt).ThenByDescending(t => t.Id)
.Select(t => new TaskRow(t.Id, t.Title, t.Assignee!.DisplayName, t.Comments.Count))
.Take(25).ToListAsync(ct);-- The correlated count needs an index to avoid scanning Comments for each task:
CREATE INDEX IX_Comments_TaskId ON dbo.Comments (TaskId);
-- Verify in the plan: an index seek with a stream aggregate, not a scan.Run 2 (after the fix): p95 = 118 ms, error rate 0.0%, thresholds PASSED
Trace: 2 SQL statements instead of 51. Record before and after in the pull request description.// A separate test proves the protections engage: abusive traffic gets 429 while a normal user is unaffected.
export const options = { scenarios: {
abuser: { executor: 'constant-arrival-rate', rate: 200, timeUnit: '1s', duration: '30s', preAllocatedVUs: 50, exec: 'abuse' },
normal: { executor: 'constant-vus', vus: 5, duration: '30s', exec: 'normal' },
}, thresholds: { 'checks{scenario:abuser}': ['rate>0.5'], 'checks{scenario:normal}': ['rate>0.99'] } };
export function abuse() { const r = http.post(`${__ENV.BASE_URL}/auth/login`, JSON.stringify({ email: 'a@b.com', password: 'x' }), { headers: { 'Content-Type': 'application/json' } }); check(r, { 'rate limited': (x) => x.status === 429 }); }
export function normal() { const r = http.get(`${__ENV.BASE_URL}/api/projects`, { headers: { Authorization: `Bearer ${__ENV.TOKEN}` } }); check(r, { ok: (x) => x.status === 200 }); sleep(1); }# CI: a short smoke load against staging after each deployment; a big regression fails the release.
- run: k6 run --vus 10 --duration 30s -e BASE_URL=$STAGING_URL load/board.jsOn the client, add the web-vitals library reporting largest contentful paint and interaction to next paint to your telemetry, and use a bundle visualizer to find oversized dependencies to lazy-load with dynamic imports. Then repeat the investigation loop for the slowest page.
Real-World Examples
- Grafana Labs acquired k6 in 2021, and it has become a widely used open source load testing tool with scripting in JavaScript, thresholds that make performance a pass or fail check, and integrations with Grafana dashboards and cloud execution. Treating performance objectives as automated thresholds is the same idea as treating tests as pipeline gates.
- Google introduced the Core Web Vitals in 2020 as a small set of user-centric metrics used in search ranking, and in March 2024 replaced First Input Delay with Interaction to Next Paint as the responsiveness metric. Measuring these in the field with the web-vitals library gives frontend teams the same kind of objective, percentile-based targets that service level objectives give the backend.
Review Questions & Answers
Averages hide the slow tail: most requests can be fast while a meaningful fraction are very slow, and users experience the slow ones, especially when a page combines many calls. Percentiles such as p95 and p99 describe what a typical worst case looks like and are what thresholds should be set against.
Query performance depends heavily on data size and distribution. A query or missing index that looks instantaneous against a hundred rows can scan millions in production, so tests against tiny datasets give false confidence. Realistic volumes reveal scans, N+1 costs, and lock contention before users do.
That the endpoint has an N+1 pattern: one query for the list plus repeated queries per row for related data. The fix is to change the query shape, using a projection or eager loading, so the related data comes back in one or two statements, then to re-measure to confirm the improvement.
Rate limits and other protections are part of the system's resilience and security, so they need verification like any other behavior. A test that sends abusive traffic and asserts that it is limited, while normal users are unaffected, proves the protections engage and do not harm legitimate traffic, which a throughput test that expects every request to succeed cannot show.