System Design Framework for Full-Stack Engineers
On this page
Learning Objective
Apply a repeatable framework to any design problem, clarifying requirements including security, estimating scale with back-of-the-envelope arithmetic, defining APIs and data, drawing the architecture, deep-diving bottlenecks and failure modes, and stating trade-offs, and use it to size and sketch the Task Board for a million users.
Concept Explanation
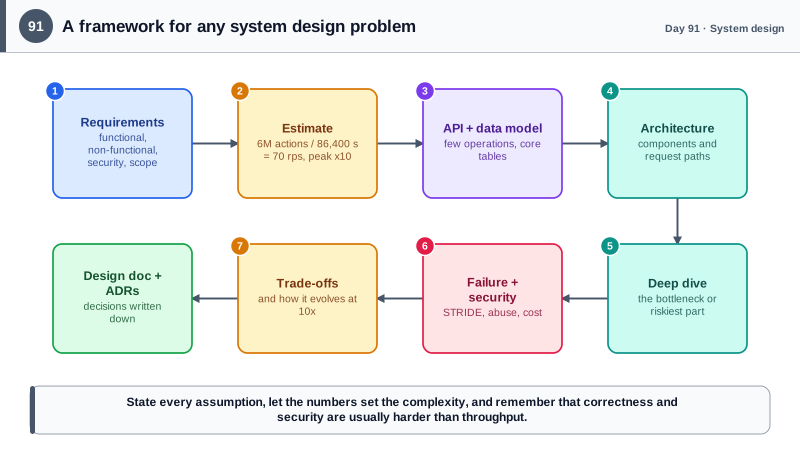
System design questions, in interviews and in real projects, are hard because they are open-ended: there is no single right answer, and beginners either freeze or start drawing boxes immediately. The remedy is a framework that turns the open problem into a sequence of small decisions, each justified. It does not produce a unique answer, it produces a defensible one, and it shows the reasoning that experienced engineers use without noticing. The steps are: clarify requirements, estimate the load, define the interface and the data, sketch the architecture, go deep on the hard parts, examine failure and security, and discuss the trade-offs and how the system would evolve.
Clarifying requirements comes first and takes several minutes. Functional requirements say what the system does: users create projects and tasks, move them, and collaborate. Non-functional requirements say how well: latency targets, availability, consistency needs, durability, and expected growth. Add the ones that are often forgotten and matter most to you now: security and privacy requirements, such as who may see what, tenant isolation, compliance, and abuse cases. Explicitly state what is out of scope. The decisions that follow depend heavily on these answers: a system that needs strong consistency for money differs from one that tolerates seconds of staleness for a feed.
Estimation is arithmetic, not precision, and its purpose is to find which dimension is hard. Convert daily numbers into per-second rates by dividing by roughly 86,400, apply a peak factor of two to ten times the average, and multiply by object sizes for storage. Jeff Dean's well-known table of latency numbers gives the scale of costs: memory access in nanoseconds, a network round trip within a data center around half a millisecond, a disk seek in milliseconds, and a cross-continent round trip around 150 milliseconds. Those numbers explain why caching helps and why chatty cross-region calls hurt. If your estimate says 2,000 requests per second, one modest database with a cache is fine; at 200,000, you need partitioning and replicas. The estimate tells you which chapter of the book applies.
Then design outward from the data and the interface. Define the handful of API operations and the core entities and their relationships, choosing the database that fits the access patterns, and only then draw components. Identify the bottleneck the numbers pointed to and go deep there. Walk through failure modes for each component, what happens when the cache is down, when a service is slow, when a message is delivered twice, and add security: who are the actors, what are the trust boundaries, what is the worst abuse, using the STRIDE walk of Day 41. Close by stating trade-offs honestly and how you would evolve the design as load grows. Martin Kleppmann's Designing Data-Intensive Applications frames the goals as reliability, scalability, and maintainability, a useful reminder that the design has to keep working and stay changeable, not only be fast.
| Step | Question | Output |
|---|---|---|
| Requirements | What must it do, how well, and what must never happen? | Functional, non-functional, security, and scope lists |
| Estimation | How much load and data, and what is the peak? | Requests per second, storage, bandwidth, the hard dimension |
| API and data model | What are the operations and entities? | A short API list and core tables |
| Architecture | Which components and flows serve those? | A simple diagram and the request paths |
| Deep dive | What is the bottleneck or riskiest part? | Detailed design of that part with alternatives |
| Failure, security, operations | What breaks or gets abused, and how do we see it? | Failure modes, threat list, monitoring, cost |
| Trade-offs and evolution | What did we give up and what changes at 10x? | Explicit decisions and the next steps |
Worked Example: The Task Board at One Million Users
The walkthrough applies the framework in order. The numbers are simple on purpose, and every assumption is stated so that it can be challenged.
1. REQUIREMENTS
Functional:   create projects, invite members, create/move/comment on tasks, live board updates, file attachments
Non-functional: p95 board load < 300 ms; 99.9% availability; a moved task visible to other members within 2 s;
                no lost updates; data durable (RPO 5 min, RTO 1 h)
Security:     strict per-project authorization; tenant isolation; audit log; GDPR export and delete; abuse limits
Out of scope: billing, mobile apps, offline mode

2. ESTIMATION (assumptions: 1,000,000 monthly users, 20% daily actives, 30 actions per active user per day)
Daily actives            = 1,000,000 x 0.2                = 200,000
Actions per day          = 200,000 x 30                    = 6,000,000
Average requests/sec     = 6,000,000 / 86,400              = ~70 rps
Peak (x10, business hrs) = ~700 rps        <- a single well-indexed SQL database and a few app instances handle this
Read:write ratio         = ~9:1 (board loads dominate)  -> reads: ~630 rps peak, writes: ~70 rps peak
Storage:  tasks 1M users x 50 tasks x 1 KB = 50 GB;  comments 1M x 200 x 0.5 KB = 100 GB;  ~150 GB, growth ~5 GB/month
Attachments (blob storage, not the database): 1M x 20 MB = 20 TB, cheap in Blob Storage
Realtime connections: 20% of daily actives online at peak ~ 40,000 concurrent SignalR connections
Conclusion: the hard parts are NOT raw throughput. They are correctness (authz, concurrency), realtime fan-out,
and keeping p95 low as the tables grow. A modular monolith on Azure SQL with caching is sufficient.

3. API AND DATA MODEL
GET  /api/projects                      GET/POST /api/projects/{id}/tasks     PATCH /api/tasks/{id}/status (If-Match)
POST /api/tasks/{id}/comments           POST /api/uploads/token               WS  /hubs/board  (join by project)
Tables: Users, Projects, ProjectMembers(ProjectId, UserId, Role), Tasks(ProjectId, Status, RowVer, ...), Comments, AuditEntries, Outbox
Access patterns: list my projects (by UserId), board by project (ProjectId, Status), task by id, comments by task (keyset)

4. ARCHITECTURE
Browser -> Front Door (WAF) -> BFF+SPA (App Service, 3+ instances) -> internal API modules
  Projects, Tasks, Notifications modules, one deployable, separate schemas (Day 70)
  -> Azure SQL (primary, geo-replica for DR)     -> Redis/HybridCache (labels, my-projects, 30 s TTL)
  -> Azure SignalR Service (40k connections)     -> Service Bus (outbox events -> emails, webhooks, search indexing)
  -> Blob Storage (attachments via short-lived SAS)     -> Key Vault, App Insights via OpenTelemetry

5. DEEP DIVES (where the risk is)
 a) Authorization at read time: membership filter inside every query; never cache lists across users (Day 67)
 b) Concurrency: If-Match/rowversion on updates, optimistic UI with rollback (Days 26, 37, 54)
 c) Realtime: notify with ids, refetch through the authorized API; group join checks membership (Day 59)
 d) The board query: index (ProjectId, Status) INCLUDE (Title); keyset pagination per column (Days 24, 39)

6. FAILURE AND SECURITY
Cache down          -> serve from SQL, watch latency; stampede protection via HybridCache
SignalR unavailable -> UI falls back to 15-second polling; no data loss because state lives in SQL
Duplicate events    -> idempotent consumers with an inbox table (Day 66)
Bad deploy          -> canary + automatic rollback (Day 89); migrations are expand/contract (Day 86)
Top threats         -> broken object authorization, cross-tenant leak, upload abuse, token theft, event flooding

7. TRADE-OFFS AND EVOLUTION
 Chose a modular monolith: fewer moving parts at 700 rps; extract Notifications first if it needs independent scaling.
 Chose SQL Server over a document store: relational integrity and transactions match the access patterns.
 At 10x (7,000 rps): add read replicas for board queries, partition Comments by project, scale SignalR units.
At 100x: shard by tenant, move search to a dedicated index, consider regional deployments.// Estimation is code too: keep a tiny calculator so assumptions are explicit and easy to change.
public static class CapacityMath
{
public const double SecondsPerDay = 86_400;
public static double AverageRps(double actionsPerDay) => actionsPerDay / SecondsPerDay;
public static double PeakRps(double actionsPerDay, double peakFactor = 10) => AverageRps(actionsPerDay) * peakFactor;
public static double StorageGb(double users, double objectsPerUser, double bytesPerObject) => users * objectsPerUser * bytesPerObject / 1e9;
}
// CapacityMath.PeakRps(6_000_000) ~ 694 rps; CapacityMath.StorageGb(1_000_000, 50, 1_000) = 50 GBPractice the framework aloud with a timer: five minutes for requirements and estimation, ten for the API, data, and architecture, fifteen for the deep dive and failure modes, and the rest for trade-offs. In a real project the same steps are spread across days and end in a design document and architecture decision records, but the order of thinking is identical.
Real-World Examples
- Jeff Dean's list of latency numbers every programmer should know, popularized from a 2009 Google talk and Peter Norvig's earlier table, remains the standard reference for the orders of magnitude involved: about 100 nanoseconds for main memory, about half a millisecond for a datacenter round trip, and about 150 milliseconds for a round trip between continents. Design decisions such as caching, batching, and avoiding cross-region calls follow from those ratios.
- Martin Kleppmann's 2017 book Designing Data-Intensive Applications organizes system design around reliability, scalability, and maintainability, and walks through the trade-offs behind databases, replication, partitioning, and streams. It has become a standard text for engineers preparing to design systems, because it teaches the reasoning behind choices instead of a catalog of products.
Review Questions & Answers
The numbers reveal which dimension is actually hard. If peak traffic is a few hundred requests per second, a modest database and a few instances suffice, and elaborate sharding would be wasted complexity. If it is hundreds of thousands, partitioning and replication are unavoidable. Estimating first ties the design to the real problem instead of to habit.
Security constraints change the design itself, for example tenant isolation influences the data model, authorization at read time limits caching and fan-out strategies, and compliance affects where data can live. Discovering these late forces redesign, while stating them up front lets the architecture accommodate them naturally.
Every design gives something up, and showing that you know what, and when it would stop being adequate, demonstrates judgment. An evolution path, such as adding read replicas at ten times the load, shows that the design can grow without a rewrite and prevents overengineering for hypothetical scale today.
Databases, queues, and services are provisioned and limited in operations per second, so a daily total is not directly comparable to their capacity. Dividing by about 86,400 gives an average rate and applying a peak factor gives the load the system must survive, which can be compared with what one instance or database can handle.