OpenTelemetry in .NET: Tracing and Metrics
On this page
Learning Objective
Instrument the React and .NET stack with OpenTelemetry, propagate W3C trace context from the browser through the BFF to the API and database, add custom spans and low-cardinality metrics, export to Azure Monitor and a local dashboard, and keep telemetry free of sensitive data and abusable ingestion endpoints.
Concept Explanation
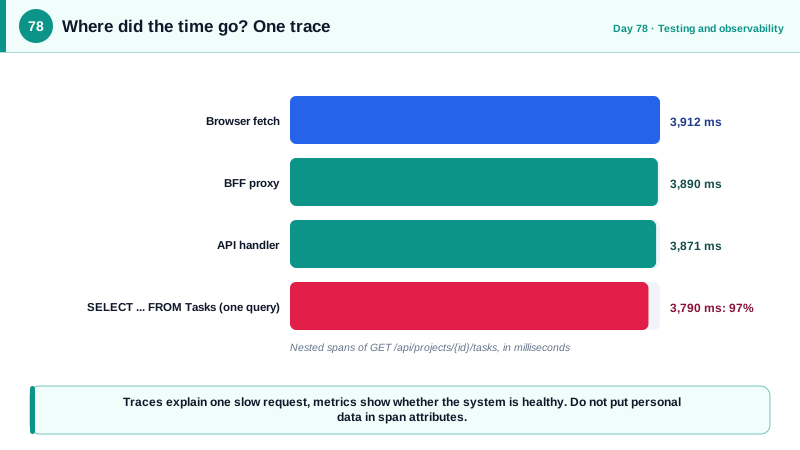
Logs tell you what a component did; traces tell you how a single request flowed through many components and where the time went. A trace is a tree of spans, each span a timed operation such as an HTTP call, a database query, or a queue publish, linked by identifiers. When a user clicks a button and the page takes four seconds, the trace shows that the browser call took 3.9 of them, the API spent most of that in a single SQL query, and that query was the one missing an index. Metrics complement traces with aggregated numbers over time, such as request rate, error rate, and latency percentiles, which are cheap to store and ideal for dashboards and alerts.
OpenTelemetry, a Cloud Native Computing Foundation project formed in 2019 by merging OpenTracing and OpenCensus, is the vendor-neutral standard for producing and exporting this telemetry: traces, metrics, and logs. The pieces that make traces connect across processes are standardized in the W3C Trace Context recommendation, published in 2021. An outgoing request carries a traceparent header containing the trace identifier and the caller's span identifier, and the receiving service continues the same trace. .NET has this built into the runtime: the Activity class is the span, ActivitySource creates spans, and System.Diagnostics.Metrics provides counters and histograms. OpenTelemetry instrumentation packages listen to those and to ASP.NET Core, HttpClient, and SqlClient, producing spans automatically, and exporters ship them to a backend over the OTLP protocol.
For a full-stack view, start the trace in the browser. The OpenTelemetry JavaScript SDK can instrument fetch calls and add the traceparent header, so the trace begins at the click and the server spans attach to it. There is a cross-origin subtlety: if the API is on a different origin, traceparent is a non-safelisted header, so the CORS policy must allow it, and the propagation must be restricted to your own origins so you do not leak trace context to third parties. With the BFF and one origin, this is simple. Exporting to Azure Monitor uses the Azure Monitor OpenTelemetry distribution, and for local development the .NET Aspire dashboard is a free OTLP-compatible viewer you can run in a container, so developers see traces of their own machine's requests.
Custom telemetry should follow a few rules. Add spans around meaningful business operations, such as moving a task or charging a payment, with attributes that help debugging, like the task identifier. Choose metric names and labels carefully: each distinct combination of label values creates a separate time series, so a label such as user id or URL with parameters explodes the cardinality and the cost. Use small bounded sets, such as the route template, status class, and outcome. Focus dashboards on the RED signals, request rate, error rate, and duration, for each service, and on saturation for resources. Security applies here too: never put secrets or personal data in span attributes, turn off capture of full SQL text unless parameters are excluded, secure the collector and exporter endpoints with TLS and credentials, and do not expose a public unauthenticated telemetry ingestion endpoint from the browser without rate limiting, since attackers can flood it or poison your data.
| Signal | Answers | Example |
|---|---|---|
| Trace | Where did this request spend its time? | Browser to BFF to API to SQL waterfall |
| Metrics | Is the system healthy over time? | p95 latency, error rate, requests per second |
| Logs | What exactly happened here? | Structured events with trace ids |
| traceparent header | Links spans across processes | Propagated by browser, BFF and HttpClient |
| Custom span | Times a business operation | MoveTask with a task id attribute |
| Bounded metric labels | Keeps cardinality and cost under control | Route template, status class, never user id |
Worked Example: .NET Setup, Custom Telemetry, Browser Propagation and a Trace Read
The configuration enables the instrumentation and exports. The service adds a span and metrics. The React snippet propagates context, and the last block shows how to read a trace.
// dotnet add package OpenTelemetry.Extensions.Hosting OpenTelemetry.Instrumentation.AspNetCore
// dotnet add package OpenTelemetry.Instrumentation.Http OpenTelemetry.Instrumentation.SqlClient Azure.Monitor.OpenTelemetry.AspNetCore
builder.Services.AddOpenTelemetry()
    .ConfigureResource(r => r.AddService("taskboard-api", serviceVersion: typeof(Program).Assembly.GetName().Version?.ToString()))
    .WithTracing(t => t
        .AddAspNetCoreInstrumentation(o => o.Filter = ctx => !ctx.Request.Path.StartsWithSegments("/health"))   // skip probe noise
        .AddHttpClientInstrumentation()
        .AddSqlClientInstrumentation(o => o.SetDbStatementForText = false)                                       // do not record SQL text
        .AddSource(TaskTelemetry.SourceName)
        .SetSampler(new ParentBasedSampler(new TraceIdRatioBasedSampler(0.2))))                                  // keep 20% of new traces
    .WithMetrics(m => m
        .AddAspNetCoreInstrumentation().AddHttpClientInstrumentation().AddRuntimeInstrumentation()
        .AddMeter(TaskTelemetry.MeterName))
    .UseAzureMonitor();                                                                                          // ships to Application Insights
// Locally: set OTEL_EXPORTER_OTLP_ENDPOINT to the Aspire dashboard container instead.

public static class TaskTelemetry
{
    public const string SourceName = "TaskBoard.Tasks";
    public const string MeterName = "TaskBoard.Tasks";
    public static readonly ActivitySource Source = new(SourceName);
    private static readonly Meter Meter = new(MeterName);
    public static readonly Counter<long> TasksMoved = Meter.CreateCounter<long>("taskboard.tasks.moved", description: "Tasks moved between columns");
    public static readonly Histogram<double> MoveDuration = Meter.CreateHistogram<double>("taskboard.tasks.move.duration", unit: "ms");
}public async Task<IResult> MoveAsync(Guid taskId, TaskState next, CancellationToken ct)
{
using var activity = TaskTelemetry.Source.StartActivity("MoveTask");
activity?.SetTag("task.id", taskId); // an identifier: fine. Titles and names: not fine.
var sw = Stopwatch.StartNew();
try
{
var result = await DoMoveAsync(taskId, next, ct);
// Labels are a small bounded set. Never user ids, never raw URLs.
TaskTelemetry.TasksMoved.Add(1, new KeyValuePair<string, object?>("to", next.ToString()), new("outcome", "ok"));
return result;
}
catch (Exception ex)
{
activity?.SetStatus(ActivityStatusCode.Error, ex.GetType().Name); // the type name, not the message
TaskTelemetry.TasksMoved.Add(1, new("to", next.ToString()), new("outcome", "error"));
throw;
}
finally { TaskTelemetry.MoveDuration.Record(sw.Elapsed.TotalMilliseconds); }
}// React: start the trace at the click and propagate context to our own origin only.
import { WebTracerProvider, BatchSpanProcessor } from '@opentelemetry/sdk-trace-web';
import { OTLPTraceExporter } from '@opentelemetry/exporter-trace-otlp-http';
import { registerInstrumentations } from '@opentelemetry/instrumentation';
import { FetchInstrumentation } from '@opentelemetry/instrumentation-fetch';
const provider = new WebTracerProvider({
spanProcessors: [new BatchSpanProcessor(new OTLPTraceExporter({ url: '/telemetry/v1/traces' }))], // via our backend, not a public collector
});
provider.register();
registerInstrumentations({
instrumentations: [new FetchInstrumentation({
propagateTraceHeaderCorsUrls: [new RegExp(`^${location.origin}/`)], // never send trace headers to third parties
ignoreUrls: [/\/telemetry\//],
})],
});// The browser ingestion endpoint must not be an open door: authenticate, cap size, rate limit, and forward.
app.MapPost("/telemetry/v1/traces", async (HttpContext ctx, IHttpClientFactory f) =>
{
if (ctx.Request.ContentLength is null or > 64 * 1024) return Results.StatusCode(413);
using var res = await f.CreateClient("collector").PostAsync("v1/traces", new StreamContent(ctx.Request.Body), ctx.RequestAborted);
return Results.StatusCode((int)res.StatusCode);
}).RequireAuthorization().RequireRateLimiting("telemetry");# Reading a trace for "the board is slow":
GET /api/projects/p1/tasks 3,912 ms (browser fetch span, trace 4bf92f...)
BFF proxy 3,890 ms
API GET /api/projects/{projectId}/tasks 3,871 ms
SQL SELECT ... FROM Tasks ... 3,790 ms <-- 97% of the time is one query
# Next step: look at the execution plan for that query (Day 39) and fix the index or the projection.Whatever you record, review it as you would a log: attributes named email, name, or token should fail code review, and a data-collection review before enabling browser telemetry protects users' privacy.
Real-World Examples
- OpenTelemetry was created in 2019 by merging the OpenTracing and OpenCensus projects under the Cloud Native Computing Foundation, ending a period of competing instrumentation standards. It is now among the most active CNCF projects, and the W3C Trace Context specification, which became a W3C Recommendation in 2021, gives every vendor a common propagation header.
- Dapper, Google's distributed tracing system described in a 2010 paper, established the ideas of spans, trace identifiers, and low-overhead sampling that modern tracers follow. The paper's argument for sampling, that keeping a small fraction of traces gives enough insight at a fraction of the cost, is why the sampler above keeps only some new traces.
Review Questions & Answers
A trace follows one request across components showing where time and errors occurred, so it answers why a specific request was slow. A metric aggregates many events into numbers over time, such as error rate and latency percentiles, which answers whether the system is healthy and drives alerts. Metrics detect problems and traces explain them.
Each distinct combination of label values creates its own time series, so a label such as user identifier or full URL creates millions of series, inflating storage cost and slowing queries, and can overwhelm the monitoring backend. Labels should come from small bounded sets such as route templates, status classes, and outcomes.
Sending traceparent to third-party origins leaks trace identifiers and internal structure to parties that should not have them, and for cross-origin requests it can trigger CORS preflights or failures. Propagating only to your own endpoints keeps the trace connected internally without disclosing context externally.
Anyone can send data to it, so attackers can flood it, run up telemetry costs, poison dashboards with fake data, or use it as an amplification path to the collector. Requiring authentication, limiting request size, applying rate limits, and forwarding through your backend restricts abuse.