Change Data Capture and Reporting in SQL Server
On this page
Learning Objective
Separate reporting workloads from transactional ones, choose between readable replicas, columnstore indexes and a warehouse, capture changes with Change Data Capture, serve aggregates to React efficiently, and protect personal data and spreadsheets exported from the system.
Concept Explanation
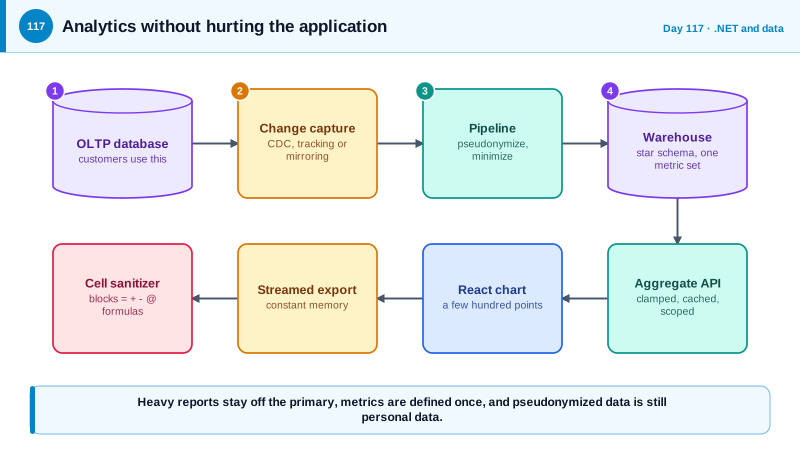
The queries a product needs to run its business are different in kind from the queries it needs to report on it. Transactional workloads read and write a few rows by key and must finish in milliseconds. Analytical workloads scan and aggregate millions of rows, and a single monthly revenue report can lock or saturate the database that customers are using to check out. The first principle is isolation: do not run heavy reports against the primary database at peak time. Several options escalate with need. A readable secondary replica offloads read queries with little effort, at the cost of slight replication lag. A nonclustered columnstore index on the operational table stores columns compressed for scanning, and lets aggregate queries run quickly on the same data. A separate analytical store, whether a warehouse or a lake, is the right answer when analysis needs joins across many sources, long history, or heavy modeling.
Getting data from the operational database to an analytical store requires knowing what changed. Change Data Capture in SQL Server reads the transaction log and records inserts, updates, and deletes into change tables that a pipeline can consume, and Change Tracking is a lighter feature that records only which rows changed. Managed services can mirror a database into an analytical platform continuously, such as mirroring into Microsoft Fabric, so you do not build the pipeline yourself. Whether you extract and transform before loading or load first and transform inside the warehouse, the useful modeling idea is the star schema, popularized by Ralph Kimball: fact tables of events and measurements surrounded by dimension tables such as date, customer, and product, which makes reports simple and fast. Agree on the definitions of metrics once, since two dashboards that compute active users differently destroy trust faster than a slow query.
Serving analytics to the React application follows the rule that the browser should receive answers, not raw data. Aggregate on the server, return the few hundred points a chart needs, cache popular results, and paginate tables with the cursor techniques from Day 24. Exports are the exception, and they must be streamed with the technique from Day 29 rather than built in memory, and generated as background jobs for large sets. Exports carry a security issue that many teams overlook: CSV or spreadsheet injection. A cell that begins with an equals sign, plus, minus, or at symbol can be interpreted as a formula when opened in a spreadsheet application, and if a user has stored a value such as a formula that calls out to a network address in a field, the person who exports and opens it can be affected. Neutralize dangerous leading characters when writing exports.
Analytics copies of data are still personal data. A warehouse full of raw customer records is a second, often less protected, place for a breach, and the deletion requests covered on Day 136 must reach it. Minimize what is copied, replace direct identifiers with pseudonymous keys where analysis does not need them, restrict access by role, mask sensitive columns, and set retention periods. Be careful with the belief that anonymization is easy: removing names from a data set often leaves combinations of attributes that identify people, and this has led to well-known re-identification of supposedly anonymous data.
| Need | Approach | Trade-off |
|---|---|---|
| A few heavy reports | Readable secondary replica | Replication lag, extra cost |
| Fast aggregates on live data | Nonclustered columnstore index | Slower writes on that table, best for scan-heavy queries |
| Cross-source history and modeling | Warehouse or lake with a star schema | Pipeline and definitions to maintain |
| Feeding the warehouse | Change Data Capture, Change Tracking or mirroring | Log retention, schema change handling |
| Charts in React | Server-side aggregates with caching | Less flexible than raw data |
| Downloads | Streamed or background exports with sanitized cells | Never build large files in memory |
Worked Example: A Columnstore Index, CDC, a Chart Endpoint and a Safe CSV Export
The T-SQL adds analytics support. The C# shows an aggregate endpoint and a streamed export that neutralizes formulas.
-- Aggregates over a large fact-like table run fast against a nonclustered columnstore index.
CREATE NONCLUSTERED COLUMNSTORE INDEX NCCI_Tasks_Analytics
ON dbo.Tasks (ProjectId, State, CreatedAt, CompletedAt, EstimateHours);

-- Change Data Capture: record changes to the table for a downstream pipeline.
EXEC sys.sp_cdc_enable_db;
EXEC sys.sp_cdc_enable_table @source_schema = N'dbo', @source_name = N'Tasks', @role_name = N'cdc_reader';

-- A pipeline reads changes between two log positions (LSNs) instead of rescanning the table.
DECLARE @from binary(10) = sys.fn_cdc_get_min_lsn('dbo_Tasks'), @to binary(10) = sys.fn_cdc_get_max_lsn();
SELECT __$operation, TaskId, State FROM cdc.fn_cdc_get_all_changes_dbo_Tasks(@from, @to, N'all');// The chart endpoint returns a small aggregate, scoped to what the user may see, and cached briefly.
app.MapGet("/api/reports/throughput", async (AppDb db, ITenantContext tenant, HybridCache cache, int weeks, CancellationToken ct) =>
{
weeks = Math.Clamp(weeks, 1, 52); // bound the work a caller can request
var key = $"throughput:{tenant.TenantId}:{weeks}";
var points = await cache.GetOrCreateAsync(key, async token =>
{
var since = DateTimeOffset.UtcNow.AddDays(-7 * weeks);
return await db.Tasks.AsNoTracking()
.Where(t => t.TenantId == tenant.TenantId && t.CompletedAt >= since) // tenant filter is explicit here too
.GroupBy(t => EF.Functions.DateDiffWeek(since, t.CompletedAt!.Value))
.Select(g => new ThroughputPoint(g.Key, g.Count()))
.ToListAsync(token);
}, new HybridCacheEntryOptions { Expiration = TimeSpan.FromMinutes(5) }, cancellationToken: ct);
return Results.Ok(points);
}).RequireAuthorization("CanViewReports");// Streamed CSV export with spreadsheet formula neutralization.
static string CsvCell(string? value)
{
var v = value ?? "";
if (v.Length > 0 && "=+-@\t\r".Contains(v[0])) v = "'" + v; // stops a spreadsheet from treating it as a formula
return "\"" + v.Replace("\"", "\"\"") + "\"";
}
app.MapGet("/api/reports/tasks.csv", async (AppDb db, ITenantContext tenant, HttpContext ctx, CancellationToken ct) =>
{
ctx.Response.ContentType = "text/csv; charset=utf-8";
ctx.Response.Headers.ContentDisposition = "attachment; filename=\"tasks.csv\"";
await using var writer = new StreamWriter(ctx.Response.Body, new UTF8Encoding(false), leaveOpen: true);
await writer.WriteLineAsync("id,title,state");
await foreach (var t in db.Tasks.AsNoTracking().Where(t => t.TenantId == tenant.TenantId)
.Select(t => new { t.Id, t.Title, t.State }).AsAsyncEnumerable().WithCancellation(ct))
await writer.WriteLineAsync($"{t.Id},{CsvCell(t.Title)},{t.State}"); // one row at a time, constant memory
}).RequireAuthorization("CanExportReports");Pseudonymized analytics key (no direct identifier in the warehouse):
analytics_user_id = HMAC-SHA256(secret_in_key_vault, user_id)
Names, emails and free text are not copied unless a report needs them, and deletion requests remove the mapping.The tenant filter appears explicitly in the report even though other layers enforce it, because reporting code paths are the ones most often written in a hurry, and a missing filter there exposes another customer's numbers.
Real-World Examples
- In 2006 AOL released roughly twenty million search queries from about 650,000 users, replacing user names with numbers, and reporters at the New York Times identified one user from her queries within days. The release was withdrawn, and it is the standard warning that pseudonymized data can still identify people when the content itself is personal.
- Ralph Kimball's 1996 book The Data Warehouse Toolkit established dimensional modeling with fact and dimension tables, and the approach is still the basis of most business intelligence reporting today. Its influence is why star schemas are the default recommendation when a team builds its first warehouse.
Review Questions & Answers
They scan and aggregate large amounts of data, which consume CPU, memory, and locks and slow the customer-facing queries that share the database. Using a replica, a columnstore index, or a separate analytical store isolates the workloads.
It records inserts, updates, and deletes from the transaction log into change tables, so a pipeline can read only what changed between two positions instead of rescanning whole tables. That reduces load and keeps the analytical copy current.
A value starting with an equals sign, plus, minus, or at symbol can be treated as a formula by spreadsheet software, so attacker-controlled data in an export can run when someone opens the file. Prefixing such values so they are read as text, and quoting fields correctly, neutralizes the risk.
The remaining attributes, such as locations, dates, or search terms, can be combined to identify a person, as happened with the released AOL search logs. True anonymization needs stronger techniques, and pseudonymized data must still be protected as personal data.