Core Web Vitals Explained: LCP, INP and CLS
On this page
Learning Objective
Define the three Core Web Vitals, Largest Contentful Paint, Interaction to Next Paint and Cumulative Layout Shift, know their thresholds and how they are assessed at the 75th percentile of real visits, break each metric into the parts you can optimize, and understand their role in user experience and search.
Concept Explanation
Performance used to be measured with technical events such as load or DOMContentLoaded, which say little about what users experience. A page can fire load late while showing useful content early, or fire it early while still being unusable. Google's Core Web Vitals, introduced in 2020, measure three user-centric qualities instead: how quickly the main content appears, how quickly the page responds to input and how stable the layout is while it loads and is used.
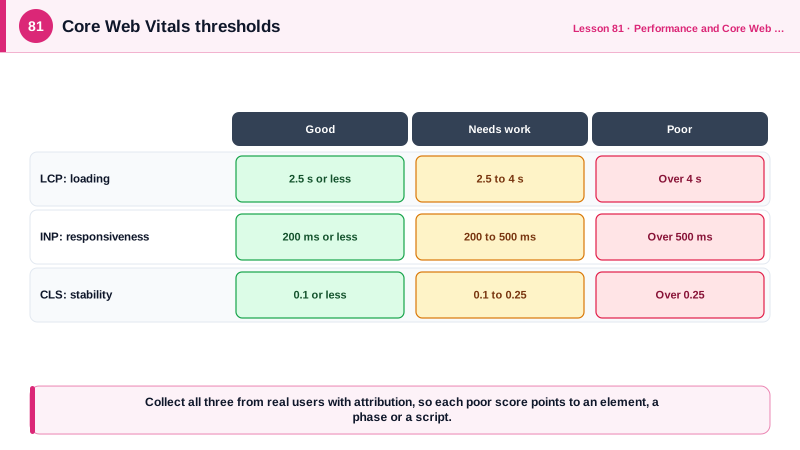
Largest Contentful Paint, LCP, is the time from navigation start until the largest image or text block in the viewport is rendered. It approximates when the user sees the main content. Good is 2.5 seconds or less, poor is above 4 seconds. LCP is best understood as four parts: time to first byte, resource load delay, which is the gap between TTFB and when the LCP resource starts downloading, resource load duration and element render delay. Most slow LCPs come from a late-discovered or low-priority hero image, render-blocking resources, slow servers or client-side rendering that delays the content (Day 83).
Interaction to Next Paint, INP, replaced First Input Delay as a Core Web Vital in March 2024. It observes every click, tap and key press during the whole visit and measures the time from the input until the next frame is painted, reporting roughly the worst interaction, ignoring outliers on pages with many interactions. Good is 200 milliseconds or less, poor is above 500. Each interaction's latency has three parts: input delay, while the main thread finishes other work, processing time in event handlers, and presentation delay for style, layout and paint of the resulting frame. Long tasks, heavy handlers, hydration and large DOM updates are the usual causes (Day 84).
Cumulative Layout Shift, CLS, measures unexpected movement of visible content. Each shift is scored by how much of the viewport moved and how far; shifts that happen within 500 milliseconds after a user input are excluded because users expect them. The metric takes the largest burst of shifts, called a session window, during the page's life. Good is 0.1 or less, poor is above 0.25. Images and embeds without dimensions, ads and banners inserted above content, web fonts that change text size and content injected after data loads are the usual causes (Day 85).
The thresholds are assessed at the 75th percentile of real page loads, separately for mobile and desktop, so a page passes only if at least three quarters of visits have a good experience. This field data comes from real Chrome users through the Chrome User Experience Report, CrUX, and appears in PageSpeed Insights and Search Console. Core Web Vitals are part of Google's page experience signals used in ranking, but relevance still dominates; their bigger value is that they correlate with business outcomes such as bounce rates and conversions.
| Metric | Measures | Good | Poor | Main parts |
|---|---|---|---|---|
| LCP | Main content visible | 2.5 s or less | Over 4 s | TTFB, load delay, load duration, render delay |
| INP | Responsiveness to input | 200 ms or less | Over 500 ms | Input delay, processing, presentation |
| CLS | Visual stability | 0.1 or less | Over 0.25 | Largest burst of unexpected shifts |
| Assessment | Real visits, 75th percentile | Per URL or origin | Mobile and desktop | From CrUX field data |
| TTFB | Server responsiveness | 0.8 s or less | Over 1.8 s | Diagnostic, not a Core Web Vital |
| FCP | First content painted | 1.8 s or less | Over 3 s | Diagnostic, not a Core Web Vital |
Worked Example: Measuring All Three with Attribution
The web-vitals library reports each metric with attribution that points at the cause, and the handler sends it to an analytics endpoint so field data is collected from every visit.
import { onLCP, onINP, onCLS } from 'web-vitals/attribution';

function send(metric) {
  const body = {
    name: metric.name,                     // 'LCP' | 'INP' | 'CLS'
    value: Math.round(metric.name === 'CLS' ? metric.value * 1000 : metric.value),
    rating: metric.rating,                 // 'good' | 'needs-improvement' | 'poor'
    page: location.pathname,
    nav: metric.navigationType,            // navigate, reload, back-forward, prerender
  };

  if (metric.name === 'LCP') {
    const a = metric.attribution;
    Object.assign(body, {
      element: a.target,                   // CSS selector of the LCP element
      ttfb: Math.round(a.timeToFirstByte),
      loadDelay: Math.round(a.resourceLoadDelay),
      loadDuration: Math.round(a.resourceLoadDuration),
      renderDelay: Math.round(a.elementRenderDelay),
    });
  }
  if (metric.name === 'INP') {
    const a = metric.attribution;
    Object.assign(body, {
      target: a.interactionTarget, type: a.interactionType,
      inputDelay: Math.round(a.inputDelay),
      processing: Math.round(a.processingDuration),
      presentation: Math.round(a.presentationDelay),
    });
  }
  if (metric.name === 'CLS') {
    body.shiftTarget = metric.attribution.largestShiftTarget;   // the element that moved most
  }

  navigator.sendBeacon('/rum', JSON.stringify(body));           // survives page unload
}

onLCP(send);
onINP(send);
onCLS(send);
A dashboard over these events answers practical questions: which element is the LCP on each template, which of the four LCP parts dominates, which button produces the worst interactions and which element shifts. That turns a red metric into a specific task.
Real-World Examples
- Google announced in May 2023 that Interaction to Next Paint would replace First Input Delay as a Core Web Vital, and the change took effect in March 2024, because FID measured only the delay of the first interaction and missed slow processing and later interactions.
- Vodafone ran an A/B test reported on web.dev in which a version of a landing page with a 31 percent better LCP led to 8 percent more sales, and other web.dev case studies link Core Web Vitals improvements to lower bounce rates and higher conversions.
Review Questions & Answers
Time to first byte, resource load delay between the first byte and the start of the LCP resource's download, resource load duration while it downloads, and element render delay between the download finishing and the element being rendered.
FID only measured the delay before the first interaction's handler started, ignoring how long handlers and rendering took and every later interaction. INP measures the full latency to the next paint for interactions throughout the visit, so it reflects real responsiveness much better.
A page passes a threshold only if at least 75 percent of real page loads meet it. This makes the assessment reflect the experience of most users, including those on slower devices and networks, rather than the average or the best case.
Shifts that occur within 500 milliseconds after a discrete user input, such as a click or key press, because users expect content to change in response to their actions. Shifts caused by animations of transform also do not count.