Lab vs Field Data: Lighthouse, CrUX and RUM
On this page
Learning Objective
Distinguish lab measurements from field measurements, use Lighthouse, the Performance panel and WebPageTest effectively, read CrUX and PageSpeed Insights data, build real user monitoring with the Performance APIs, and set up performance budgets and regression checks in CI.
Concept Explanation
There are two fundamentally different ways to measure performance, and both are needed. Lab data is collected in a controlled environment: a specific device profile, network throttling, an empty cache and a scripted page load. Lighthouse, the Chrome DevTools Performance panel and WebPageTest produce lab data. It is reproducible and detailed, which makes it ideal for debugging and for catching regressions before release. But the lab is not your users. It cannot know how real devices, networks, cache states, logged-in content, geography and user interactions vary, and it cannot measure INP well, because there are no real interactions in a scripted load.
Field data comes from real visits. The Chrome User Experience Report, CrUX, aggregates Core Web Vitals from opted-in Chrome users over a rolling 28-day window, by origin and for popular URLs, and powers PageSpeed Insights' field section and Search Console's Core Web Vitals report. CrUX is free and authoritative for what Google sees, but it is aggregated, delayed and limited to Chrome and to pages with enough traffic. Real user monitoring, RUM, fills the gaps: your own script collects metrics from every visit, as Day 81 showed, along with your own dimensions such as page template, release version, logged-in state, country, device class and experiment variant. Commercial RUM products and open-source tooling based on the web-vitals library both work.
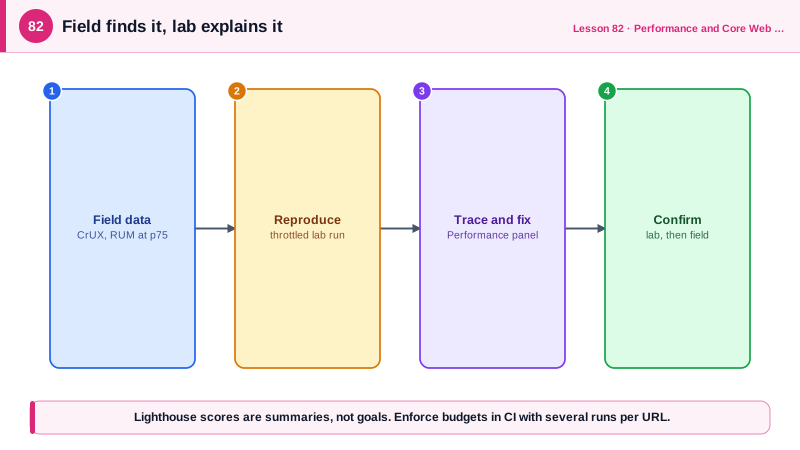
The two kinds of data answer different questions. Field data tells you whether users have a problem and where: which templates, devices and countries are slow at the 75th percentile. Lab data tells you why: the Performance panel's trace shows long tasks, layout, network waterfalls and the exact code responsible. A healthy workflow starts from field data to find the problem, reproduces it in the lab with a matching device and network profile, fixes it, verifies the fix in the lab and then confirms it in the field after release. Lighthouse scores are useful summaries but should never be the goal on their own, since a page can score well in the lab and still be slow for real users.
The browser exposes the raw measurements through the Performance APIs. Navigation Timing and Resource Timing give network phases, PerformanceObserver delivers paint, LCP, layout shift and event timing entries, the Long Animation Frames API attributes slow frames to the scripts that caused them, and User Timing's performance.mark and measure let you time your own spans, such as how long a search takes to render results, which appear in the Performance panel and can be reported to RUM.
Preventing regressions needs automation. Performance budgets set limits on metrics or resources, such as a maximum JavaScript size per route, an LCP limit in Lighthouse CI or a minimum score. Running Lighthouse CI or WebPageTest on every pull request against a stable environment catches regressions before they ship, while bundle size checks catch the most common cause, growing JavaScript. Lab runs vary, so take the median of several runs and set budgets with some tolerance.
| Source | Type | Best for | Limits |
|---|---|---|---|
| Lighthouse | Lab | Audits, opportunities, CI checks | Single synthetic load, no real INP |
| Performance panel | Lab | Root cause: tasks, layout, network | Your machine, manual |
| WebPageTest | Lab | Real devices and locations, filmstrips | Synthetic, scripted |
| CrUX and PageSpeed Insights | Field | What Google sees, 28-day p75 | Aggregated, Chrome only, traffic threshold |
| Search Console | Field | Groups of URLs failing vitals | Delayed, coarse |
| RUM | Field | Every visit with your dimensions | Needs setup and storage |
| User Timing | Both | Custom spans like search render time | You choose what to mark |
Worked Example: Custom Timing in RUM and a Lighthouse CI Budget
The search page marks its own spans and reports them with the release version. The CI configuration fails a pull request when lab metrics or resource sizes exceed the budget.
// Custom spans with User Timing, visible in the Performance panel and sent to RUM
async function runSearch(query) {
  performance.mark('search:start');
  const results = await fetchResults(query);
  performance.mark('search:data');
  renderResults(results);
  await new Promise(requestAnimationFrame);                     // wait for the frame to be produced
  performance.mark('search:painted');
  const m = performance.measure('search:total', 'search:start', 'search:painted');
  navigator.sendBeacon('/rum', JSON.stringify({
    name: 'search_total', value: Math.round(m.duration),
    release: window.__RELEASE__, device: navigator.hardwareConcurrency <= 4 ? 'low' : 'high',
  }));
}

// Long Animation Frames: which scripts made frames slow
new PerformanceObserver((list) => {
  for (const frame of list.getEntries()) {
    if (frame.duration < 200) continue;
    const worst = [...frame.scripts].sort((a, b) => b.duration - a.duration)[0];
    navigator.sendBeacon('/rum', JSON.stringify({ name: 'loaf', duration: Math.round(frame.duration), source: worst?.sourceURL, fn: worst?.sourceFunctionName }));
  }
}).observe({ type: 'long-animation-frame', buffered: true });{
"ci": {
"collect": { "url": ["http://localhost:4173/", "http://localhost:4173/products/demo"], "numberOfRuns": 5 },
"assert": {
"assertions": {
"largest-contentful-paint": ["error", { "maxNumericValue": 2500 }],
"cumulative-layout-shift": ["error", { "maxNumericValue": 0.1 }],
"total-blocking-time": ["warn", { "maxNumericValue": 200 }],
"resource-summary:script:size": ["error", { "maxNumericValue": 180000 }]
}
}
}
}Five runs per URL with median-based assertions reduce noise. Total blocking time is used in the lab as a proxy for INP, since there are no real interactions to measure.
Real-World Examples
- PageSpeed Insights shows both a field data section from CrUX, labeled with the 28-day collection period, and a lab section from Lighthouse, and Google's documentation explains that the two often disagree because they measure different things under different conditions.
- The Long Animation Frames API shipped in Chrome 123 in 2024 to improve on the Long Tasks API by attributing slow frames to specific scripts, functions and source locations, which RUM providers adopted to explain poor INP in the field.
Review Questions & Answers
Lighthouse measures one synthetic load on a simulated device and network with an empty cache and no real interactions. Real users have different devices, networks, content and behavior, and INP depends on actual interactions, so field results can be much worse than the lab suggests.
Data from every visit in every browser, without CrUX's traffic thresholds and 28-day aggregation, broken down by your own dimensions such as page template, release, logged-in state and experiment variant, and with attribution details that explain causes.
Use field data to find which pages, devices or regions are slow, reproduce the problem in the lab with matching device and network conditions, use traces to find the cause and fix it, verify the improvement in the lab, then confirm in field data after release.
Lab measurements vary from run to run because of CPU scheduling, network noise and timing. Taking the median of several runs reduces false failures and makes budgets reliable enough to enforce.